Observing Tools
Contents:
A main driver function is makeAnnualChart()
- observing.dms(d, delim=':', output_string=False)[source]
Convert degrees, minutes, seconds to decimal degrees, and back.
EXAMPLES:
dms(‘150:15:32.8’) dms([7, 49]) dms(18.235097) dms(18.235097, output_string=True)
Also works for negative values.
SEE ALSO: hms()
- observing.drawAnnualChart(dates, hrs, visibility, title='', fs=16, dt=0)[source]
Draw charts computed by makeAnnualChart().
INPUTS: - dates, hrs, visibility
Inputs suitable for pylab.contourf(dates, hrs, visibility)
- fs : scalar
Font size
- observing.hms(d, delim=':', output_string=False)[source]
Convert hours, minutes, seconds to decimal degrees, and back.
EXAMPLES:
hms(‘15:15:32.8’) hms([7, 49]) hms(18.235097) hms(18.235097, output_string=True)
Also works for negative values.
SEE ALSO: dms()
- observing.isObservable(dates, obs, target, minElevation=30, twilight=12, oversamp=16)[source]
True if pyEphem object ‘target’ is visible to observer ‘obs’ on the input ‘dates’; False otherwise.
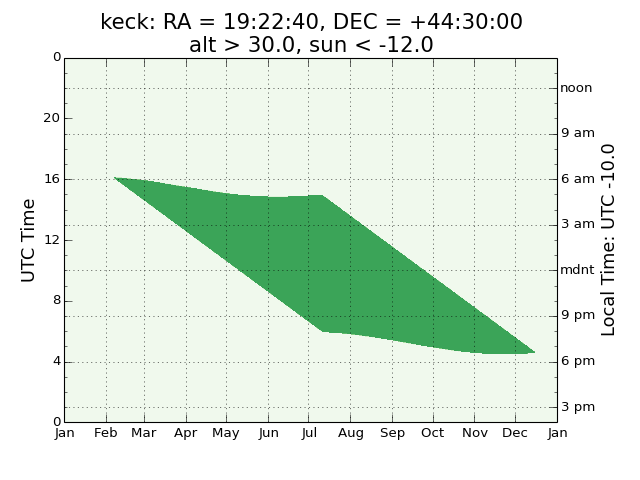
- observing.makeAnnualChart(obs, ra, dec, minElevation=30, twilight=12, oversamp=16, dt=0)[source]
Make pretty plots of target visibility during the year. E.g., to observe the Kepler field from Keck:
(Source code, png, hires.png, pdf)

INPUTS: - obs : str
- ‘lick’ or ‘keck’ or ‘lapalma’ or ‘mtgraham’ or ‘mtbigelow’ or
‘andersonmesa’ or ‘kpno’ or ‘ctio’ or ‘cerropachon’ or ‘palomar’ or ‘cerroparanal’ or ‘lasilla’ or ‘calaralto’ or ‘lascampanas’ (cf. setupObservatory())
- minElevation : float
Minimum visible elevation angle. ‘30’ implies airmass=2.
- twilight : float
Minimum acceptable angular distance of sun below horizon, in degrees.
- dt : scalar
Timezone offset from UTC. Positive for east, negative for West.
EXAMPLE: import observing as obs # Plot Visibility of the Kepler Field: obs.makeAnnualChart('keck', '19:22:40', '+44:30:00', dt=-10) obs.makeAnnualChart('mtgraham', '19:22:40', '+44:30:00', dt=-7)
NOTES: Based on the attractive plots used by the California Planet Search team.
- observing.setupObservatory(obs, lat=None, long=None, elevation=None)[source]
Set up PyEphem ‘observer’ object for a given observatory.
INPUTS: - obs : str
Name of an observatory. ‘lick’ or ‘keck’ or ‘lapalma’ or ‘mtgraham’ or ‘mtbigelow’ or ‘andersonmesa’ or ‘kpno’ or ‘ctio’ or ‘cerropachon’ or ‘palomar’ or ‘cerroparanal’ or ‘lasilla’ or ‘calaralto’ or ‘lascampanas’ or ‘saao’ or ‘sidingspring’